Optimize the performance
of your sorting centers

Optimize the performance of your sorting centers

Continuous analysis of the sorting process to maximize operational efficiency and availability.

Transforming data into performance

Our performance optimization solution gives you a complete and in-real-time view of your sorting process. Through continuous waste flow analysis, we detect improvement opportunities and support you in implementing them. Statistical data from our equipped sites lets us design tailored solutions, with a target of 5% higher yield per site.

  • Around forty gantries in service across France
  • AI trained on millions of real images from sorting centers
  • A dedicated team: project engineer, data analyst, trainer and technical support

The performance indicators of your sorting center

360° analysis of your operations in real time

Flow composition and quality

Detailed analysis of material composition and purity, which determines the resale price of sorted materials.

Equipment performance

Real-time monitoring of the efficiency of each automatic or manual sorting unit.

Quantification of human interventions

Measurement of sorting operators’ activity, to balance workloads and improve working conditions.

Indicators tracked continuously

  • Mass purity
  • Recoverable rate
  • Mass flow rate, instantaneous and daily
  • Process availability

Every measurement can be expressed by mass, object count or surface area, per material category or per object type.

Continuous monitoring of the sorting process

A permanent overview of the entire process helps identify all optimization opportunities.

Continuous measurement

Real-time analysis of material composition and flows.

Drift detection

Automatic identification of performance deviations with alerts.

Critical anomaly detection

Detection of dangerous and oversized objects to prevent incidents.

Objectively measuring each sorting step

Comparing what goes into the line with what comes out shows where recoverable material is lost, and lets you check the effect of every adjustment.

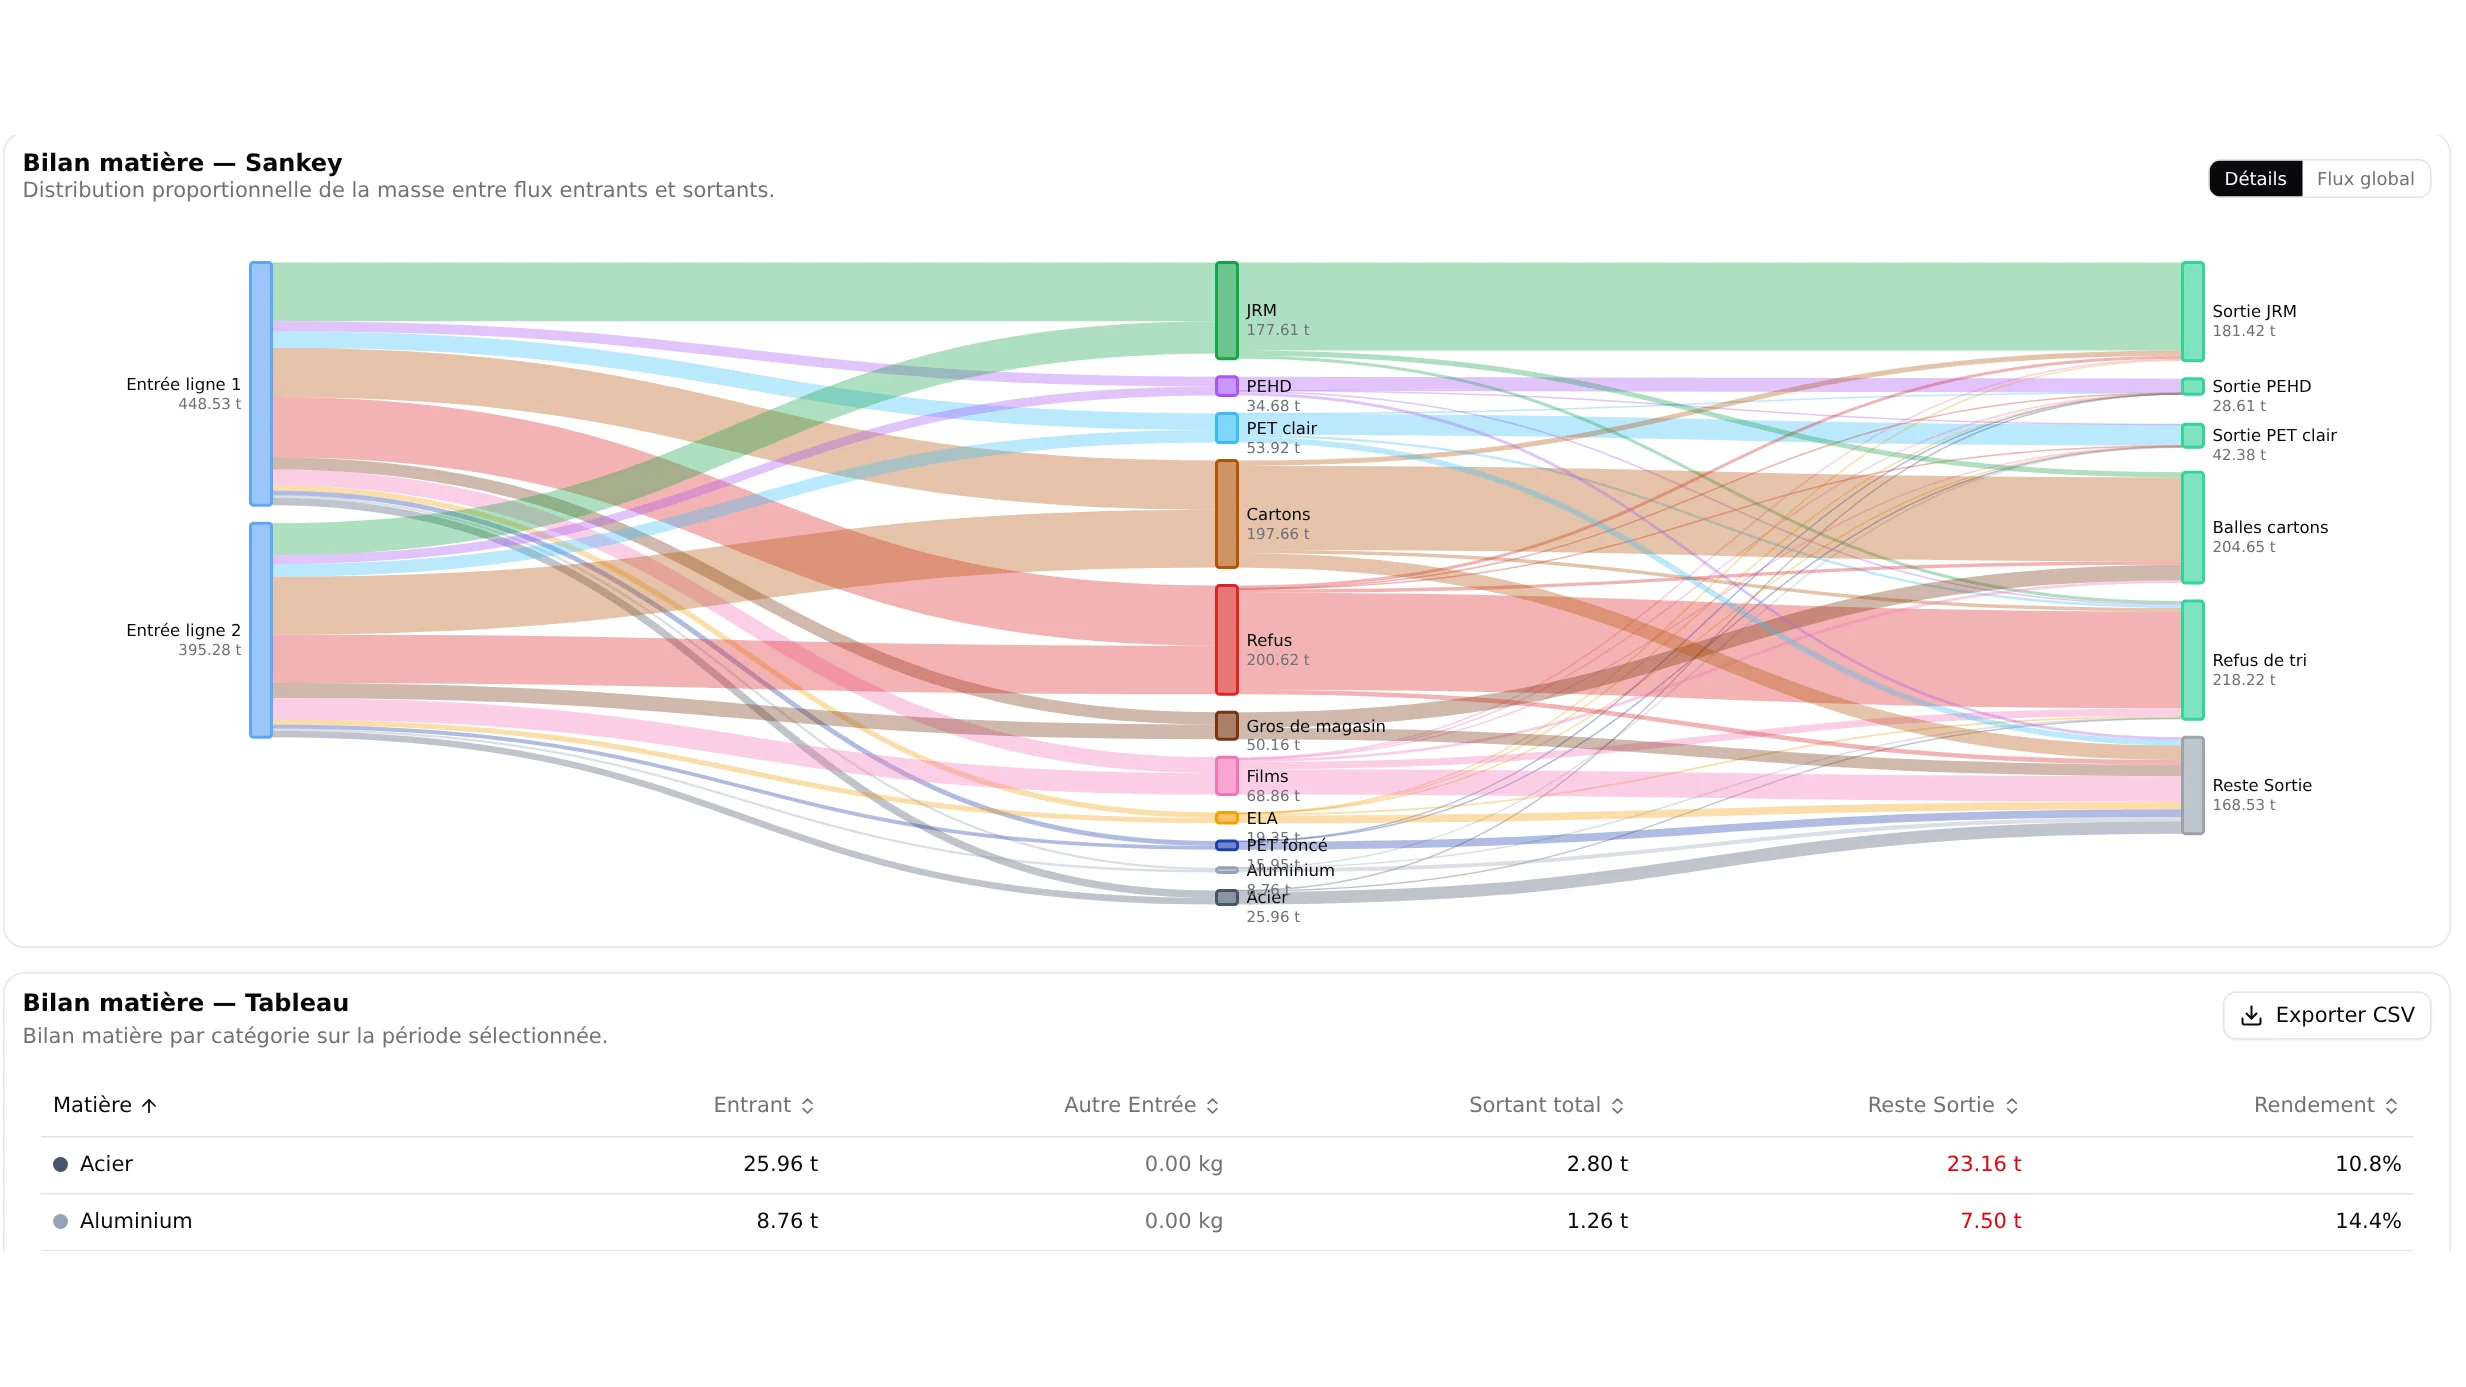
Wasoria Pilot screenshot: material balance between two input lines and the sorting center outputs, as a Sankey diagram.

Input / output material balance

The material balance between inbound and outbound flows highlights the separation efficiency and yield of your line, material by material.

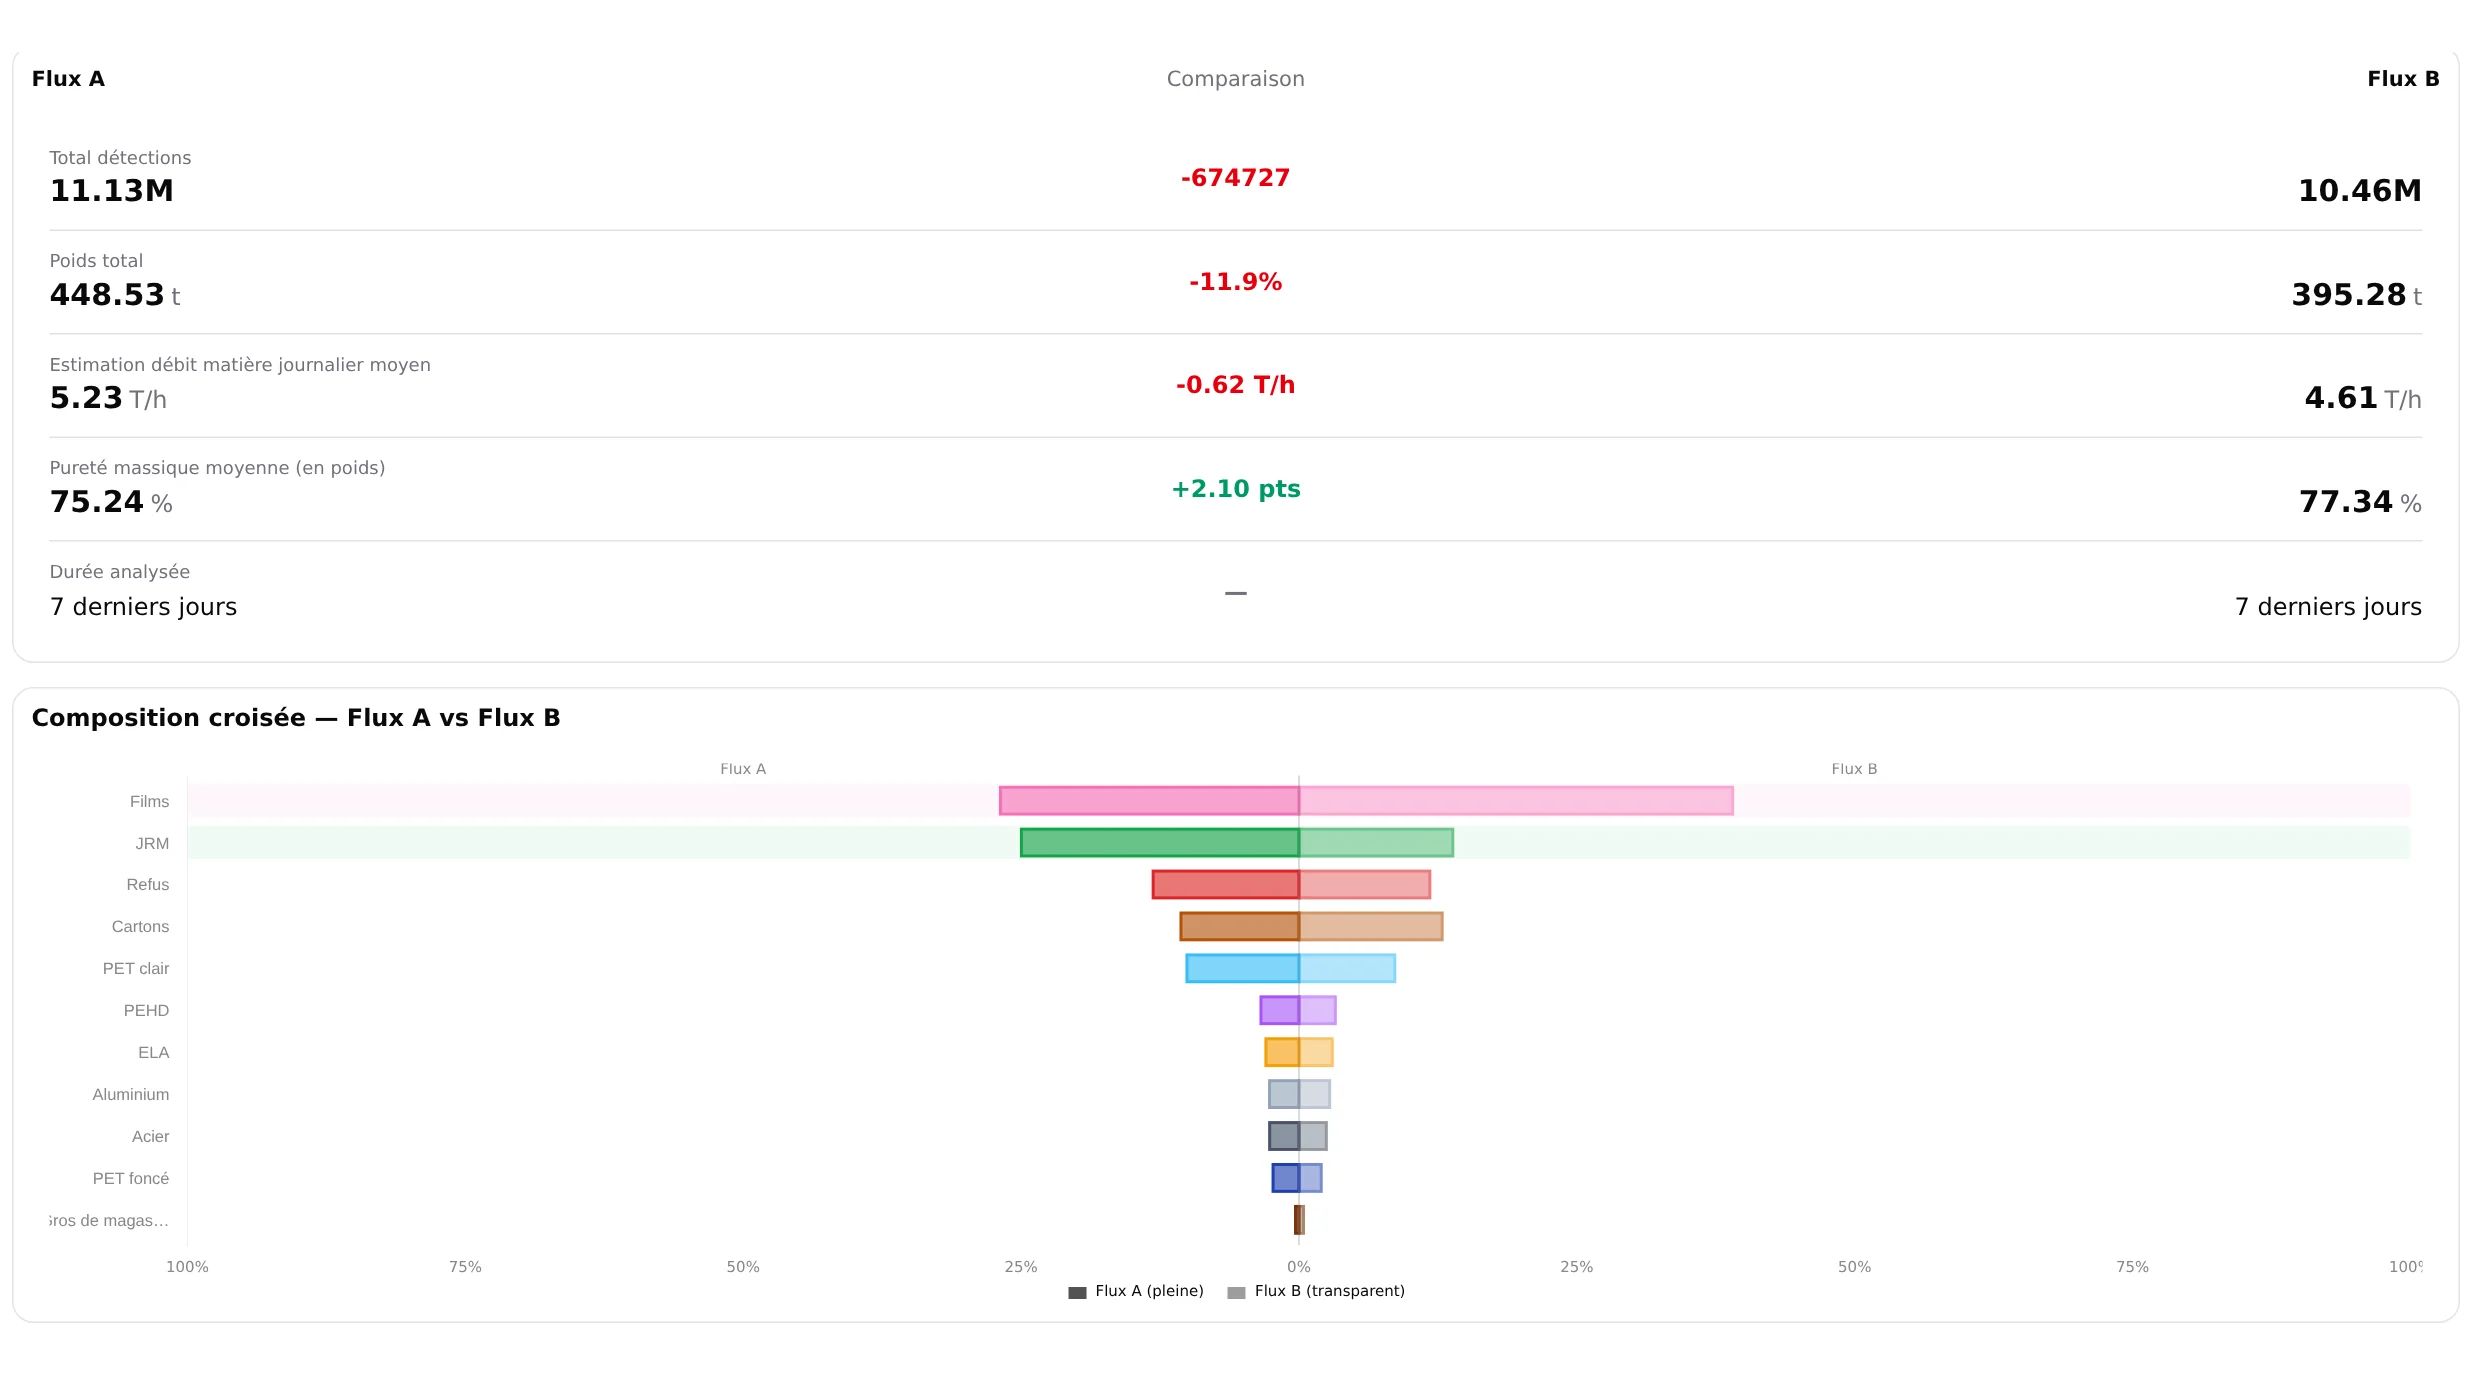
Wasoria Pilot screenshot: comparing the weight, flow rate, purity and composition of two flows.

Before / after comparison

Two flows or two periods side by side, to measure the effect of an adjustment, an organizational change or a shift in inbound flows.
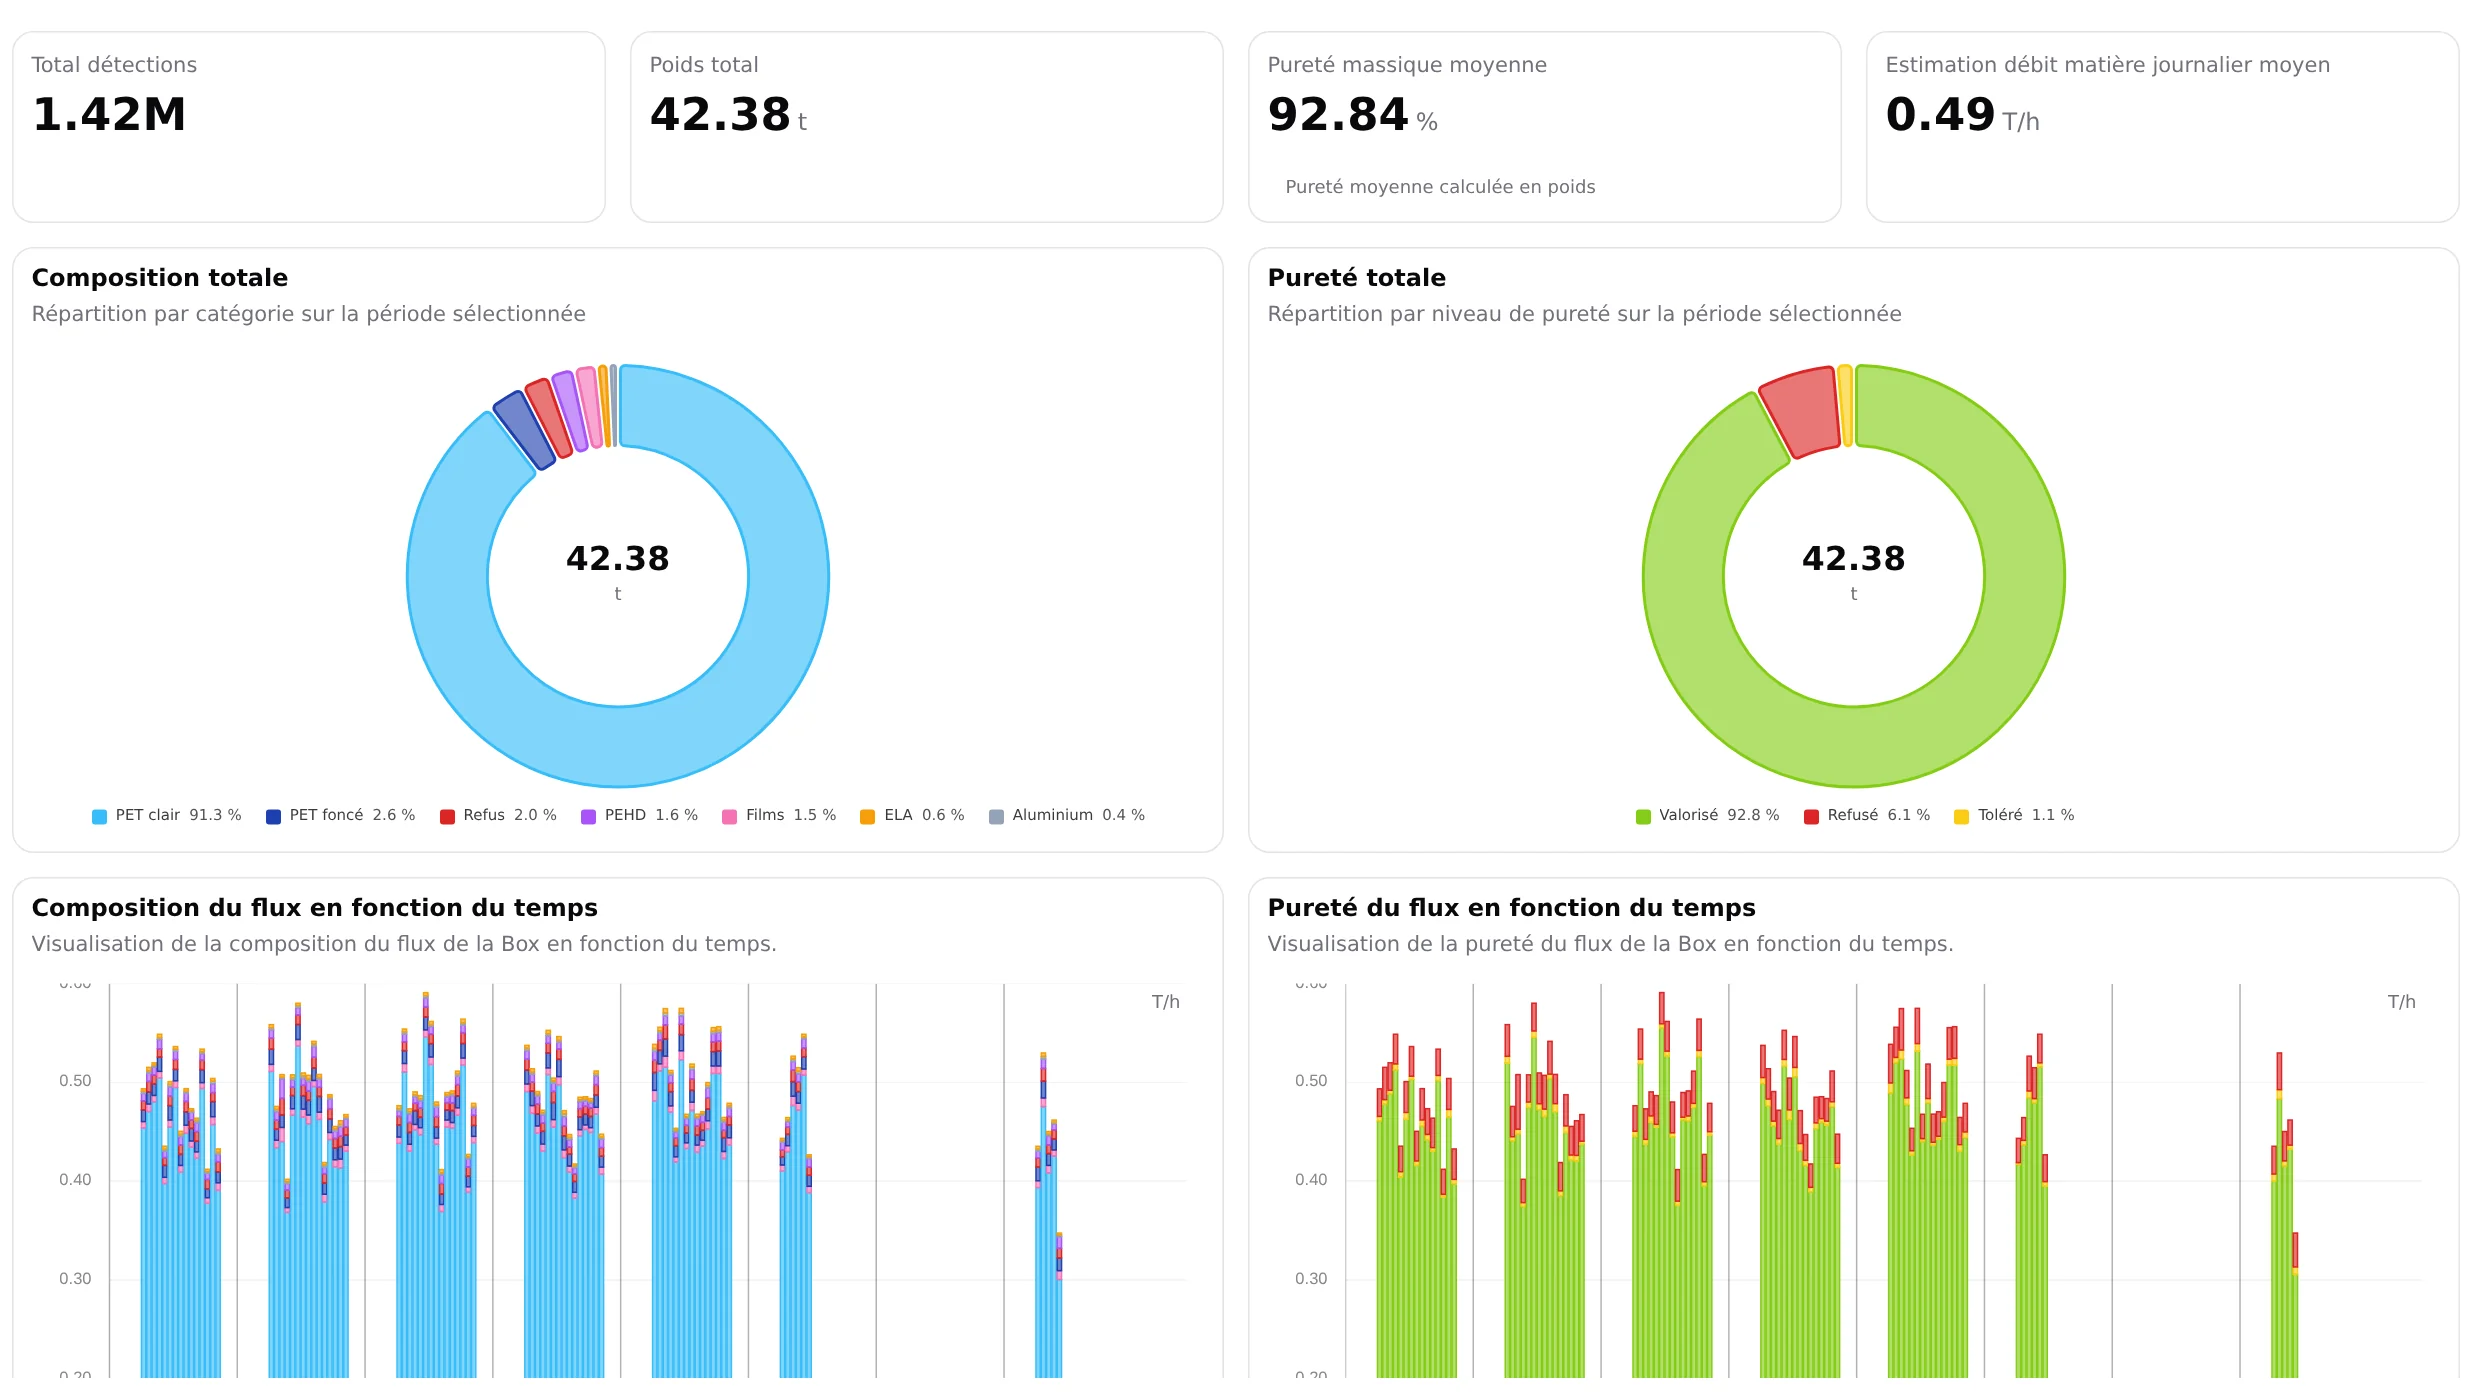
Wasoria Pilot screenshot: composition and purity of the clear PET output over seven days.

Tracking a flow over time

Composition, purity and flow rate of a flow over the period of your choice, to spot slow drifts as well as one-off deviations.

Diagnosing the causes of underperformance

Through precise, real-time monitoring of your sorting center, we identify the root causes of inefficiencies and offer concrete solutions to address them.

Underperforming or failing sorting equipment

The material balance measures the separation efficiency of the line, and statistical alert analysis highlights recurring times, equipment and incident types.

Sorting station organization to optimize

Measuring sorting operator activity objectively assesses the workload at each manual station, to spread the work better and adapt the organization.

Degraded quality of incoming flows

The composition of inbound flows reveals the share of sorting errors. Combined with waste characterization, it helps target your awareness campaigns.

From analysis to action

Data analysis alone is not enough: you need to act quickly and effectively. Our solution turns every detected anomaly into a concrete action.
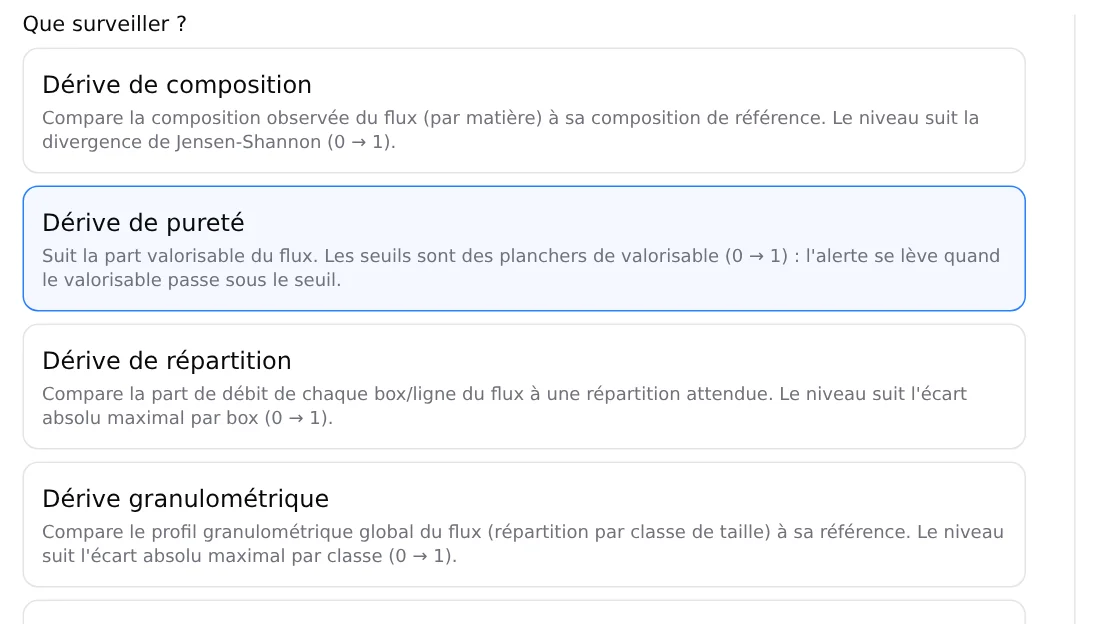
Wasoria Pilot screenshot: choosing the type of drift to monitor (composition, purity, distribution, particle size) when creating an alert trigger.

Smart alerts in Wasoria Pilot

You define your triggers (purity, composition, line distribution or particle size drift) and their severity thresholds. Every deviation shows up in real time in Wasoria Pilot and on Wasoria Rondier, the mobile app for your field teams.

Wasoria Pilot → PLC → Sorting line

Interaction with the sorting line through the PLC

Depending on how your center is configured, Wasoria Pilot sends the information to your line's PLC, which triggers the planned response without waiting for manual intervention.
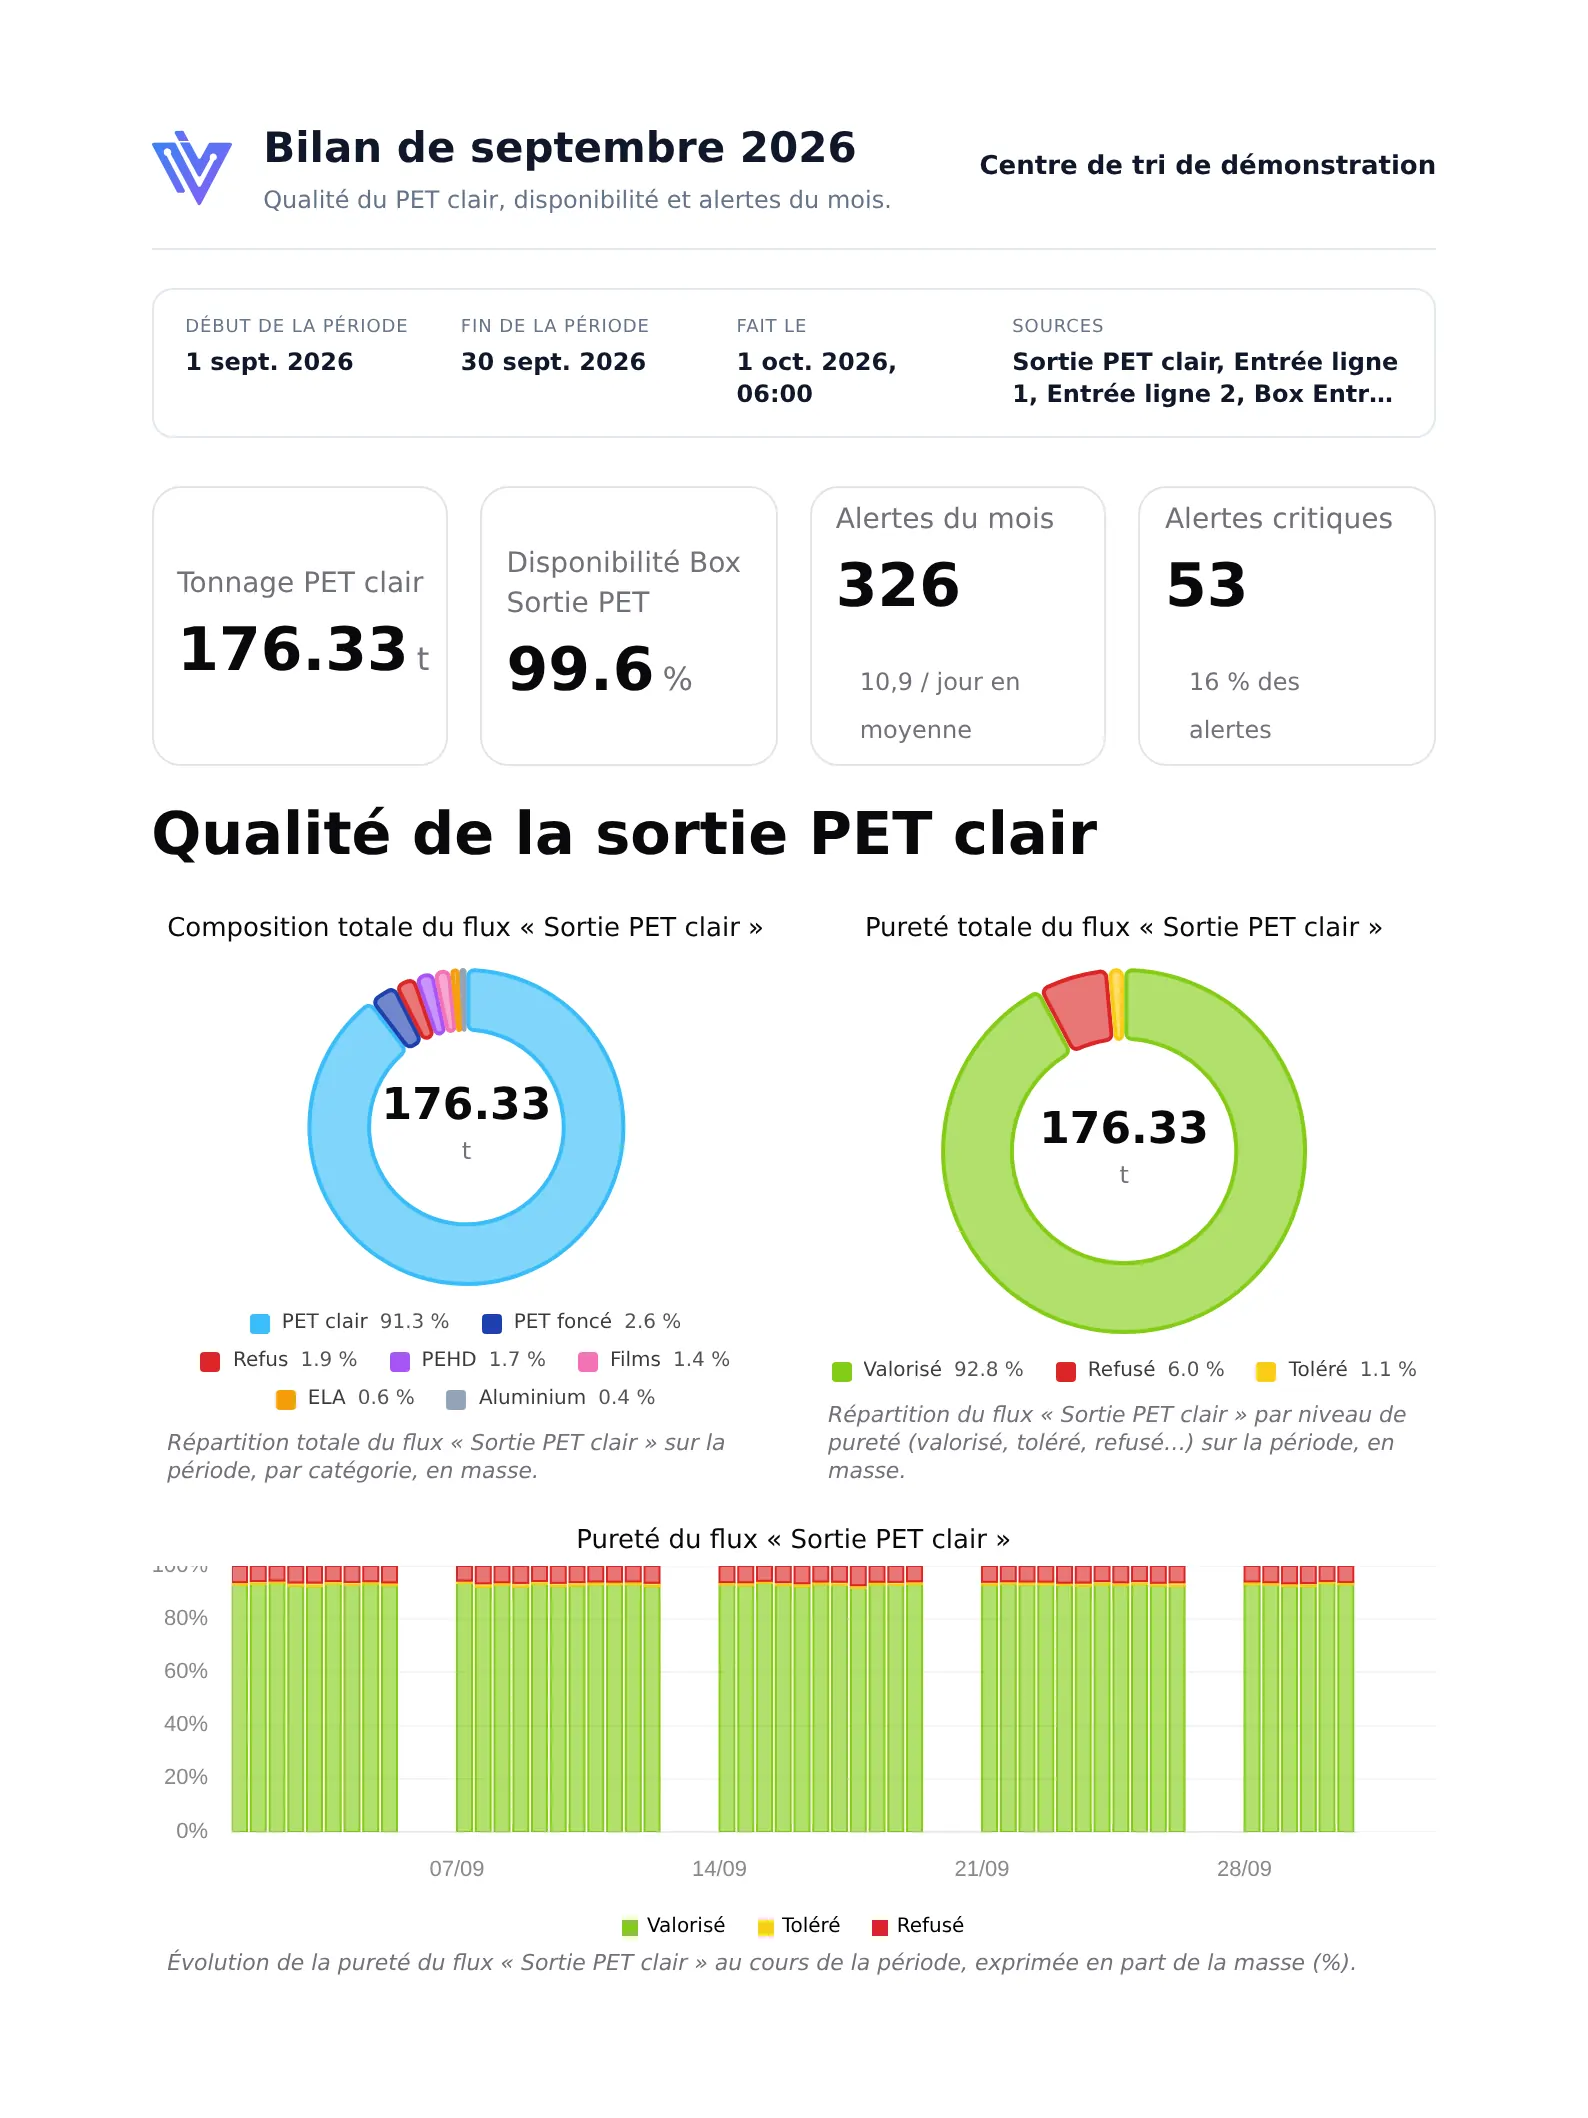
Screenshot of a monthly Wasoria Pilot report: tonnage, availability, alerts and quality of the clear PET output.

Personalized optimization recommendations

A Wasoria data analyst studies the data from your line and proposes an action plan. Wasoria Pilot reports then let you measure the effect of each action.

A continuous improvement approach

Optimization is carried out in cycles, with your teams. A complete cycle typically lasts between 3 and 6 months, depending on the complexity of your site and your objectives.

01

Observation

Assessment: site visit, flow mapping, definition of objectives and key indicators.

02

Analysis

Diagnosis: continuous monitoring of your operations, statistical flow analysis, anomaly detection.

03

Intervention

Implementation of a tailored action plan: technical interventions, organizational optimizations, human support.

04

Evaluation

Before / after results, detailed performance report and objectives for the next cycle.

Frequently asked questions about performance optimization

Which indicators do you track?

We track flow composition and purity, the efficiency of each sorting unit, automatic or manual, and the activity of sorting operators. Together, these measurements give a complete view of how the line operates, from input to output.

How is the data collected?

By the Wasoria Box, mounted on a gantry above the conveyor. It combines a high-resolution color camera and a thermal sensor, and its artificial intelligence analyzes every object in real time. Measurements are centralized in Wasoria Pilot, on a server installed in your sorting center.

What is the point of measuring sorting operator activity?

To objectively assess the workload at each manual sorting station. These measurements help spread the work more evenly between stations, adapt how they are organized and improve working conditions for operators.

How are performance drifts reported?

Through real-time alerts in Wasoria Pilot, ranked by severity. You define your own triggers: drifts in purity, composition, distribution between lines or particle size, with your severity thresholds, observation window and evaluation frequency.

Does the solution also spot dangerous objects?

Yes. Continuous monitoring of the line also spots dangerous and bulky objects, to prevent incidents. See our dangerous object management solution.

How do you identify the causes of underperformance?

By cross-checking the measurements taken continuously across the whole line, we trace the problem back to its source: underperforming or failing sorting equipment, sorting stations that need reorganizing, or degraded quality of incoming flows. Our recommendations also draw on statistical data from our equipped sites.

Who analyzes the data and makes the recommendations?

The Wasoria team. A project engineer leads the deployment, a data analyst studies the data from your line and proposes a tailored action plan, a trainer helps your teams build their skills, and technical support handles day-to-day follow-up. You stay in control of the decisions and how they are carried out.

Can Wasoria act on the sorting line?

Yes, depending on how your center is configured, through the PLC of your sorting line. Wasoria Pilot sends it the information, and the PLC triggers the appropriate response, without waiting for manual intervention. Wasoria Pilot also communicates with your business tools.

Does production need to stop for the installation?

No. The gantries are installed above your existing conveyors, usually during maintenance periods or outside production hours.

What performance gain can we aim for?

Our goal is a 5% increase in yield per site. The actual gain depends on your line, your flows and the actions chosen, which is why we start by establishing a quantified baseline of your sorting center.

How long does an optimization program take?

A complete cycle typically lasts between 3 and 6 months, depending on the complexity of your site and your objectives: 2 to 4 weeks of observation, 4 to 8 weeks of analysis, 4 to 12 weeks of intervention, and ongoing evaluation. Each new cycle starts again with more ambitious objectives.

Can we monitor several sorting centers?

Yes. We support multi-site groups: the approach standardizes best practices from one site to the next, while adapting to the specific features of each.

How do you measure the effect of the actions taken?

We define the indicators to track with you from the start, then compare performance before and after each action. In Wasoria Pilot, you build your reports (composition, material balances, indicators, alerts), export them as PDF or CSV and can receive them by email on a recurring basis. See our approach.

Ready to optimize your sorting center?

Let’s talk about your flows and goals: we will identify the first performance gains together.