Waste characterization, from sample to report
Measure the composition and quality of your flows to manage sorting and material recovery.
What is waste characterization?
Waste characterization measures the composition of a waste flow. A sample is taken, separated by material category (paper, cardboard, plastics, metals, contaminants), and each category is weighed to determine its share of the total.
In a sorting center, it applies at both ends of the process. On incoming flows, it measures the quality of selective collection and the share of sorting errors. On outgoing flows, it checks the purity of sorted materials before they are sent to recycling. On sorting residue, it shows what the line lets through.
Its results are both a management tool for the operator and a shared reference with local authorities, producer responsibility organizations and material buyers. Their reliability therefore matters as much as their frequency.
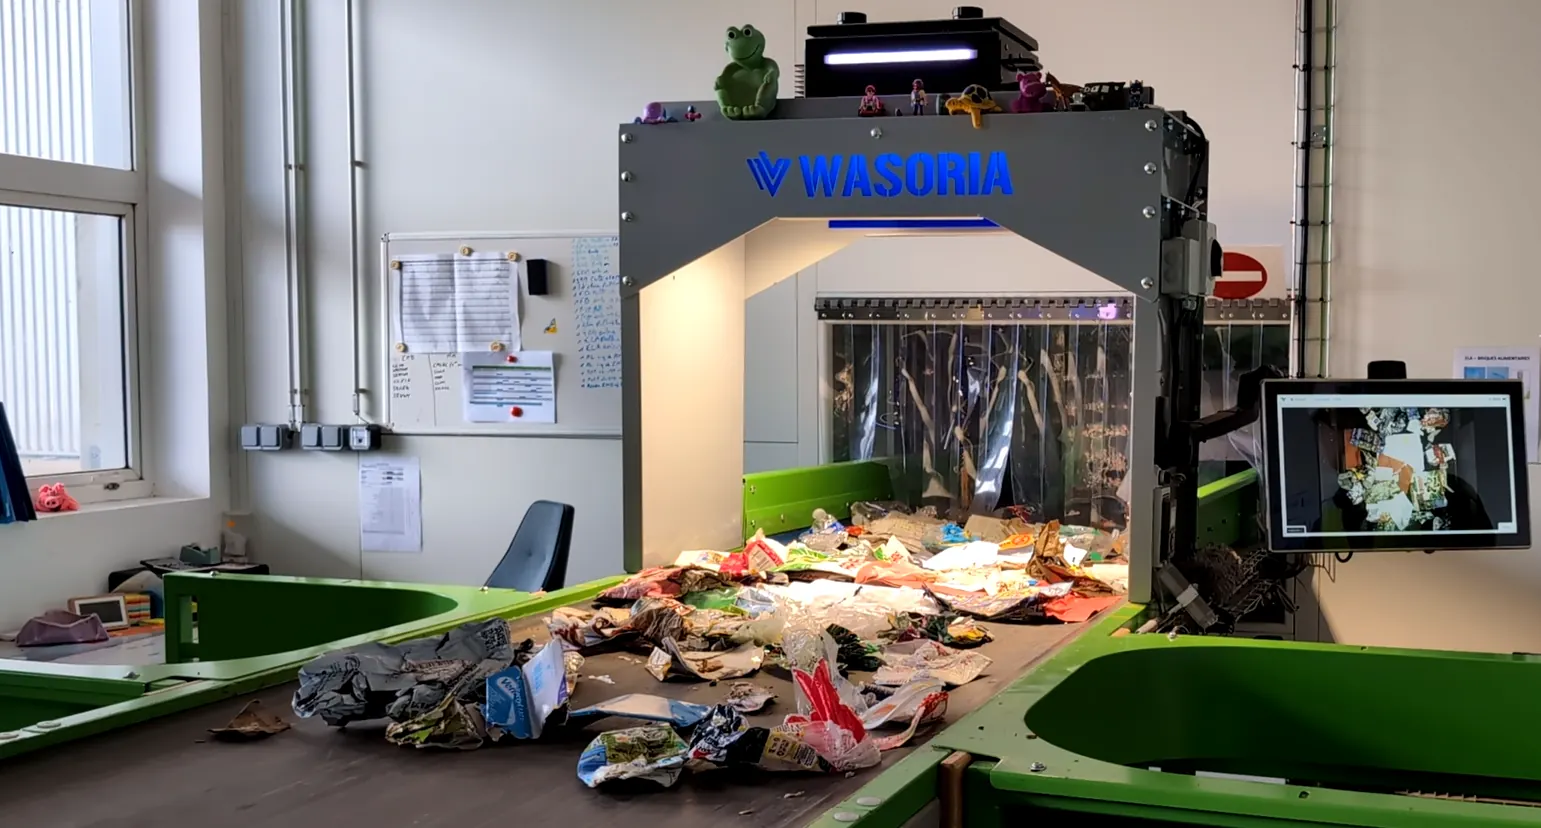
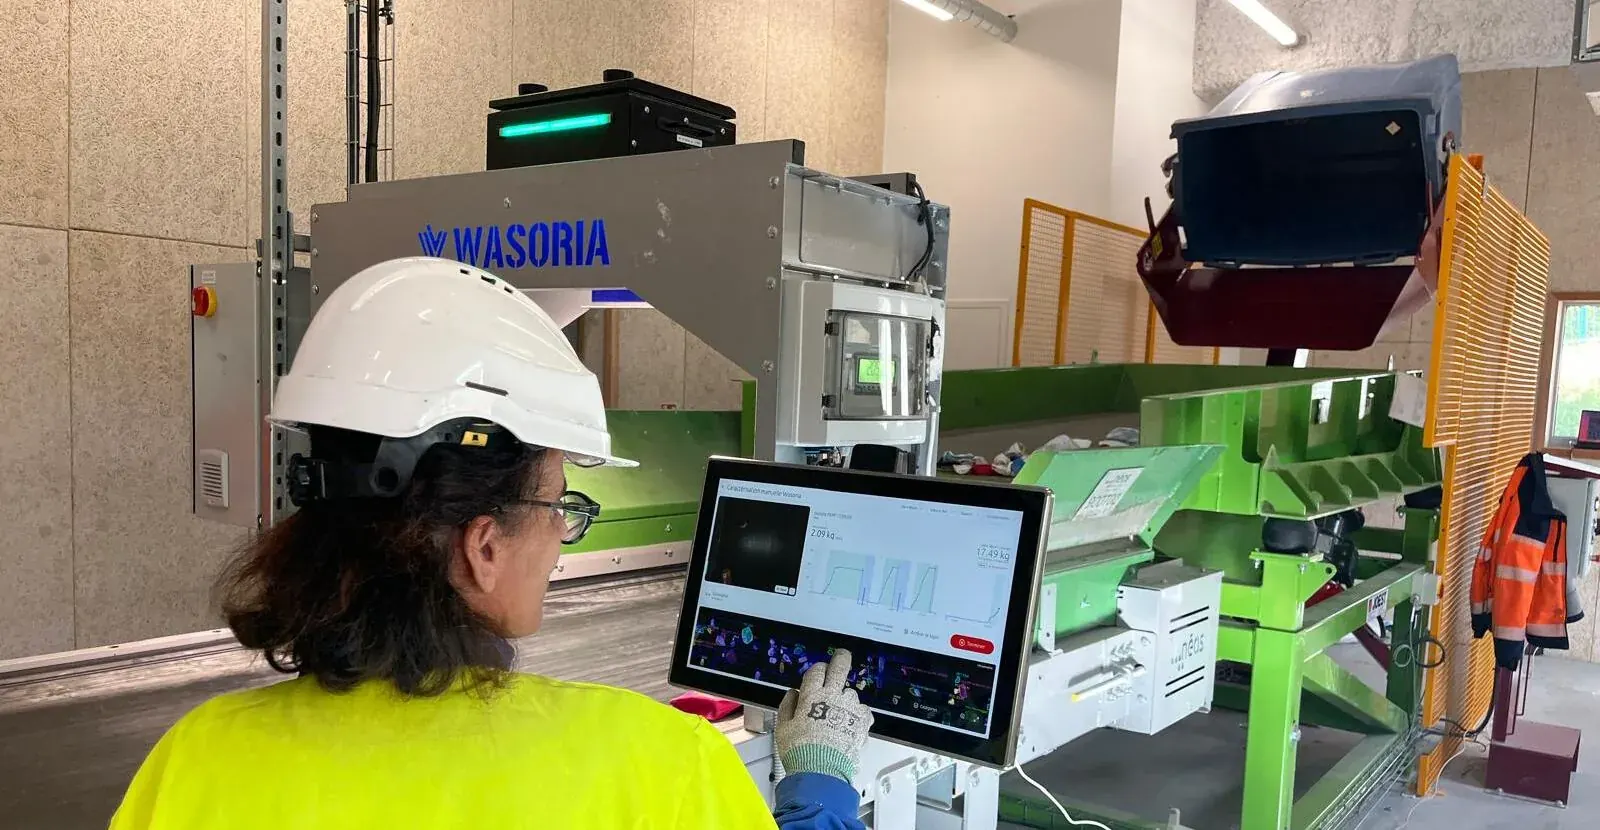
Characterization is still mostly done by hand, on a characterization bench. Artificial intelligence can now automate most of it: this is what Wasoria Characterization does.
What characterization measures
Reliable data to manage your sorting center and work with your partners.
Flow composition
The share of each material in an incoming or outgoing flow, to know what you receive and what you produce.
Mass purity
The share of target material in a sorted flow, calculated on weight: the indicator that determines material value.
Sorting errors
Waste that does not belong in selective collection, including dangerous objects, to target awareness campaigns.
Material lost in residue
Recyclable materials that end up in the residue instead of being sorted: material that will never be recovered.
Sorting efficiency
By comparing incoming flows, outputs and residue, you can estimate how much of each material the line actually recovers.
Trends over time
Historized results to compare periods and measure the effect of a setting change or a communication campaign.
What are characterization results used for?
The same measurement, several uses depending on who reads it.
Adjusting the sorting line
For the operator: spot a drop in quality, adjust equipment and the organization of sorting stations. See performance optimization.
Guaranteeing material quality
For material buyers and recyclers: show that shipped bales meet the quality standards of their recycling stream.
Reporting to partners
For local authorities and producer responsibility organizations: document the quality of received and sorted flows, a common basis for monitoring contracts and extended producer responsibility (EPR) schemes.
Targeting awareness campaigns
Know which sorting errors are most frequent and, if samples are linked to their collection round, where they come from, to tailor messages to residents.
Comparing several sites
For a waste authority or a group: apply the same method in every sorting center to compare their results on a common basis.
Preparing investments
Base a line modernization project or a change in sorting instructions on measured data rather than estimates.
Which flows should be characterized?
The method stays the same; the goal depends on where the sample is taken.
Incoming selective collection
What residents put in their recycling bin: collection quality, share of each material and sorting errors.
Sorted materials
Output flows (PET, HDPE, cardboard, paper, steel, aluminum…): purity and contaminants, before they are shipped to recycling.
Sorting residue
What the line did not sort: lost recyclable materials and non-recyclable objects, to improve recovery.
Residual household waste
The general waste bin, analyzed in characterization studies (the MODECOM method of ADEME) to measure what could have been sorted.
How does manual characterization work?
Five steps, from sampling to report.
-
01
Take the sample
It is taken from the flow (collection skip, line output, residue) following a defined protocol that ensures it is representative.
-
02
Prepare it
It is mixed and, if needed, reduced by coning and quartering (keeping two opposite quarters) until the quantity to sort is reached.
-
03
Sort by category
On the characterization bench, operators separate each object by hand according to the chosen category grid: materials, formats, contaminants.
-
04
Weigh each category
Each category is weighed, then compared with the total weight of the sample to obtain the composition and mass purity.
-
05
Record and share
Results are recorded, often on paper and then in a spreadsheet, consolidated and sent out as a report.
The limits of manual characterization
Challenges that weigh on reliability and efficiency
A time-consuming process
Sorting and weighing by hand keeps operators on a strenuous, repetitive task, at the expense of their other work.
Variable results
From one operator to another, from one day to the next, the same object is not always classified the same way: comparisons over time suffer.
Limited traceability
Paper sheets, re-entered data, scattered spreadsheets: results are hard to find, check and keep on record.
Few measurements, fixed reports
The time each characterization takes limits how many are done, and hand-built reports are hard to use for new analyses.
Manual or automated characterization: what changes
The same sample, the same categories: AI takes over sorting, classification and data entry.
| Manual | Automated | |
|---|---|---|
| Sample placement | Spread by hand on the bench | A tipper and a vibrating feeder lay it in an even layer on the conveyor |
| Sorting by category | Object by object, by hand | An AI gantry identifies and classifies every object that passes |
| Classification criteria | Vary from one operator to another | Identical from one characterization to the next |
| Composition and mass purity | Calculated after weighing each category | Obtained from the AI analysis and the weighing of the sample |
| Data entry and reports | On paper, then in a spreadsheet | Results recorded automatically, PDF report or data by email, API or dashboard |
| Operator role | Sort and weigh | Load, run from the touch terminal, validate |
Learn more: discover Wasoria Characterization, or monitor the quality of your flows continuously, directly on the sorting line, with performance optimization.
Frequently asked questions about waste characterization
What is waste characterization?
What is a waste characterization study?
What is the MODECOM method?
What is the difference between incoming and outgoing flow characterization?
What is mass purity?
How does manual characterization work?
How often should flows be characterized?
What does automating characterization bring?
Does AI replace characterization operators?
What can a camera not see?
Do I need to replace my characterization bench?
How long does it take to train operators?
Explore more
-
 Wasoria Box The AI sensor that analyzes your waste streams in real time.
-
 Wasoria Pilot The complete solution to steer and supervise your sorting operations in real time.
-
 Wasoria Characterization An advanced automatic solution for flow characterization.
-
 Performance Optimization An in-depth analysis of the sorting process to maximize real-time performance.
-
 Dangerous Objects Prevention Detection and management of dangerous objects to ensure safety and integrity of sorting operations.
Automate your characterizations
Request a demonstration of Wasoria Characterization on your bench and your flows.